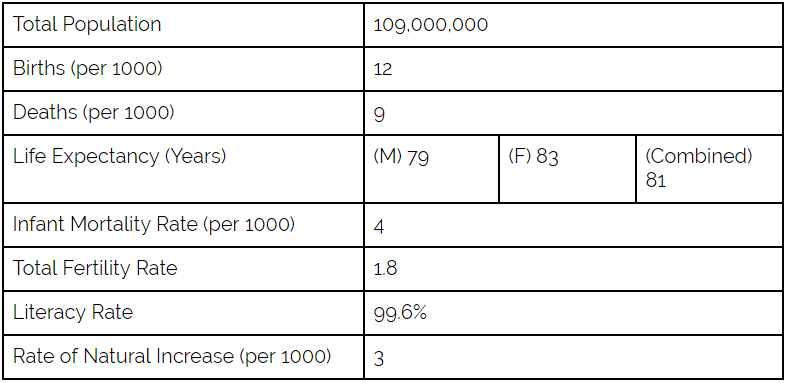
The above demographics indicate an MDC region, as it has the characteristics of an MDC nation or region. Firstly, the birth rate on average in North Europe is relatively low, which is an indicator of MDC environments, as in MDCs women tend to have less children in their lifetime. Their death rate also indicates an MDC region, due to both having a low death rate, and that death rate being close to the birthrate (i.e a low RNI), indicating a levelling off of population growth. Infant mortality rate is low, which is a marker of MDC development (well developed healthcare). Life expectancy is high, indicating a an MDC level of healthcare. Overall, this indicates an MDC region.


Base is smaller than overall width of pyramid, low childbirth. Width rapidly decreases after 65 years of age, indicating an aging (but not deeply aged) population. Average age seems around mid 30s. Seems to be in Stage 4, may face problems if transitions to Stage 5.

Base smaller than rest of pyramid, age bracket of 15-19 shows rapid decrease in comparison to older brackets, dip may indicate sudden drop in population. Majority of people seem to be in mid 50s, probably not natural, due to previously sted reasons. In age brackets 60 and above men are in stark decline in comparison to women, may indicate war or improved age expectancy for women. Seems a strange Stage 4, may suffer due to aging population and low child population.

Low population base, expands slightly up until age 60, indicates a low birthrate. Majority of people in 65 bracket, indicates old population. After that bracket, population rapidly declines. Seems Stage 4 transitioning to Stage 5, will suffer due to aging working population.
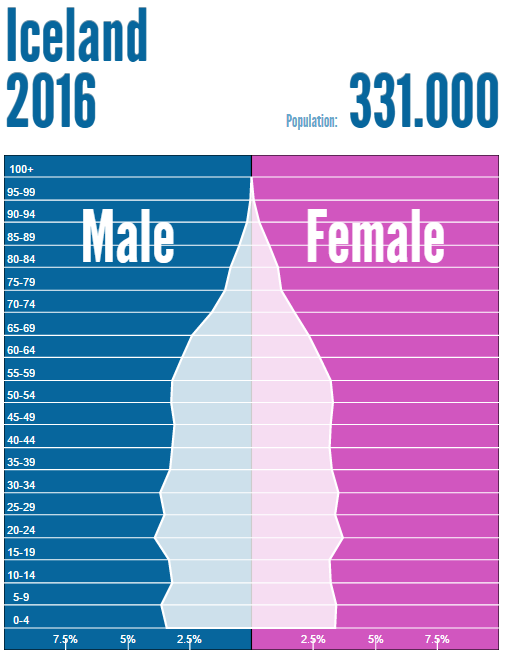
Iceland’s base is almost as thick as the thickest bracket, but due to sloping shape seems to be indicative of sustained childbirth. Average age seems 30-40, however, age brackets 65 and above remain significant. Stage 4, may someday have Stage 5 problems, but not anytime soon.

Base of pyramid not thicker than other age brackets, however, age brackets 10 through 25 are smaller than rest of graph, may indicate a war or other calamity, and in recent years childbirth may have bounced back. Majority of people are in 35 age bracket, gentle slope into older brackets. Stage 3 due to aforementioned child age brackets having large chunk missing, may have to deal with large chunk of youth brackets missing when reaching work age.

Base smaller than rest of pyramid, age brackets 15-19 have a depression indicating either a large change in childbirth rates or some illness or other event. Pyramid widens from 25 through 55, indicating a 35 through 50 age bracket majority. Elderly age brackets of 55 and above have significantly less members in male brackets than in female bracket. Stage 4 into Stage 5, will have to deal with aging population and declining workforce.

Has base smaller than rest of pyramid, low childbirth. Pyramid not smoothly shaped, potentially indicating childbirth rates changed regularly, immigration, or illness have affected the country. Similar lack of males in elderly age brackets as compare to Latvia and Lithuania, possibly relating to independence from Soviet Union in 90’s. Stage 4 due to outside factors, will face Stage 5 difficulties unless childbirth increases.

Base slightly smaller than rest of chart, low but stable childbirth rates. Graph is relatively even until bracket of 65, after which population sharply decreases. Chart indicates a solidly Stage 4 country, will face aging population problems of Stage 5 country.

Base smaller than rest of graph, shape indicates recent decrease in childbirth. Chart somewhat uneven after 15 age bracket, but overall distributed evenly until bracket 65, after which population decreases sharply. Stage 4, will move into Stage 5 and deal with aging workforce and increased elderly population.

Base same size as rest of pyramid, indicates low but stable childbirth. Population evenly distribute for most part, slight bulge around 50 bracket, after which sloping decrease in population. Stage 4, unlikely to move into Stage 5 anytime soon, but may have to deal with aging population.

*Not shown: Iceland
Based upon this map, the most dense region by far is southern Britain, with a density of 195 and above people per kilometer. Certain small areas within other countries have similar densities; these denote cities or major metropolitan areas. The Scandinavian countries as a whole are very sparse, possibly due to an inhospitable environment. Overall, Northern Europe is 81 percent urban, with certain areas, such as Iceland, being up to 94 percent urban. This explains the extreme sparseness visible in Scandinavia, except for a few pockets of population denseness.
